Nym Node Checker - configuration health tool for node operators (or just me!)

The problem

As a Nym node operator I kept running into the same problem: I couldn’t get clear answers about whether my node was actually configured correctly. The existing explorers give you plenty of data about tokens, uptime, delegations and rewards - but none of them tell you the simple things. Are the right ports open? All of them? Is IPv6 working? Is the hardware sufficient?

And it’s not a theoretical problem. I’ve seen operators running with ports silently closed, or without IPv6 declared even though every node is expected to. It’s not that it breaks anything immediately - it’s against the rules, and there’s no easy way for an operator to catch these things without checking manually.

My own technical skills weren’t enough to dig into all of this manually every time something changed. I wanted a tool that would just tell me: here’s what’s right, here’s what’s wrong, here’s your score out of 100. Clear, detailed, no guessing. So I built one.

What it does:

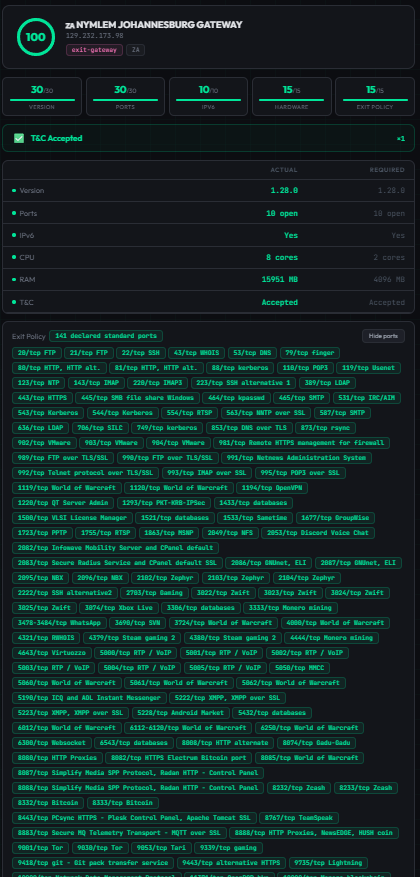
You enter your node’s IP or hostname - it instantly checks whether your node is configured correctly and gives it a score out of 100 points.

Scoring breakdown for regular mixnodes and gateways:

Exit gateways (100 pts max):

  • Version (30) - is the node running the latest nym-node version
  • Ports (30) - are all required ports open
  • IPv6 (10) - is IPv6 connectivity available
  • Hardware (15) - does CPU/RAM meet minimum requirements
  • Exit Policy (15) - standard Nym exit policy declared
  • T&C - multiplier: not accepted = total score 0

Mixnodes (100 pts max):

  • Version (30) - is the node running the latest nym-node version
  • Ports (30) - are all required ports open
  • IPv6 (20) - is IPv6 connectivity available
  • Hardware (20) - does CPU/RAM meet minimum requirements
  • T&C - multiplier: not accepted = total score 0

Key features:

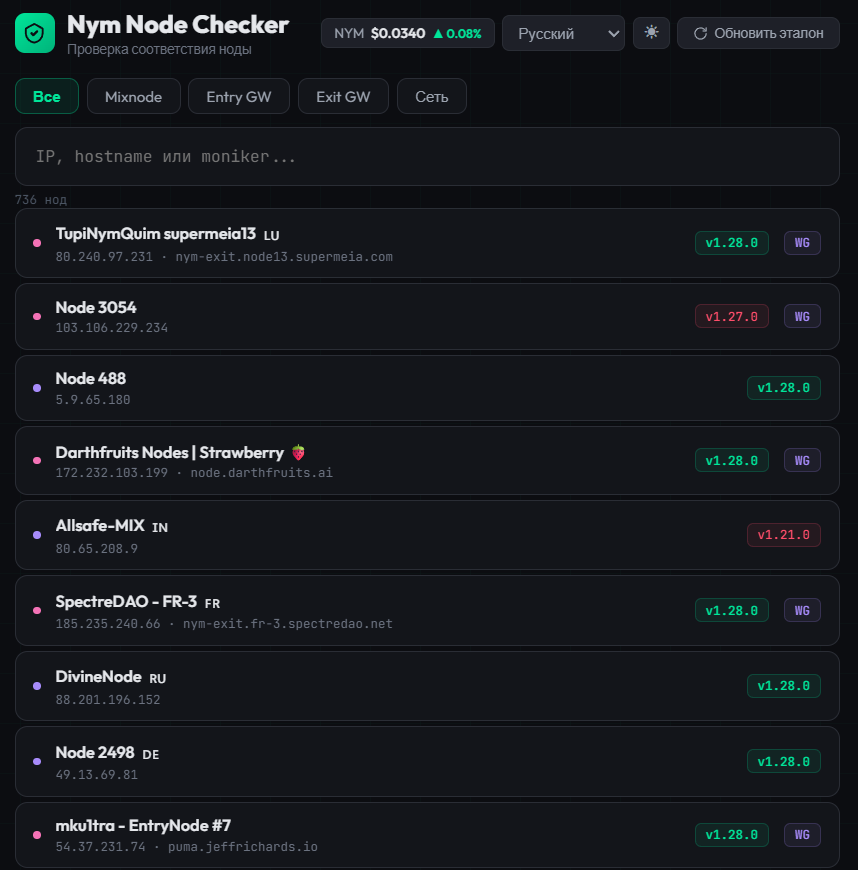
  • Instant single-node diagnostic via IP or hostname
  • Full node directory with search by moniker, IP, identity key, node ID
  • Network-wide statistics (version distribution, T&C acceptance, IPv6 adoption)
  • Auto-syncing reference data:
    • Latest nym-node version fetched from GitHub releases (downloads the actual binary and extracts the version)
    • Required ports parsed from the official NTM script
    • Exit policy fetched from the official Nym source (nymtech.net)
  • Port change detection and changelog scanning for new port requirements
  • IPv6 verification via external agent + DNS AAAA resolution
  • Hardware check from the node’s system-info endpoint
  • NYM/USD live price widget
  • Dark/light mode
  • 9 languages: English, Russian, Ukrainian, Turkish, Chinese, Spanish, German, French, Italian
  • Also, a small but pleasant detail in my opinion - if you suddenly forget to switch your keyboard layout to English and start typing, no worries! My checker will still find your node.

Background automation (no manual intervention needed):

  • Node directory refresh every 30 min
  • Reference sync (version + ports) every 6 hours
  • Exit policy refresh every hour
  • Daily IPv6 scan across all nodes

Tech stack:

  • Backend: Python, FastAPI (~700 lines)
  • Frontend: vanilla HTML/CSS/JS (~280 lines, single file, no build step)
  • Deployed on a VPS

URLs: http://185.186.76.89:8000 / http://185.186.76.89:8080

Who is it for:

I built this for myself first. But the more I used it and showed it to other operators, the more I realized there’s a gap that neither official nor community explorers (nymesis.vercel.app, explorer.nym.spectredao.net) are filling. They do a great job with analytics, economics, and network overview - but they don’t answer the basic operational question: is my node set up correctly, right now, in detail? That’s what this tool does. If it’s useful to others, I’ll be very glad.

Where I want to take it:

  • Buy a proper domain
  • Alerting - notify operators when something breaks (port goes down, version falls behind)
  • Batch checking for operators running multiple nodes
  • More detailed exit policy verification

But the direction I’m most excited about is turning this into an onboarding tool for newcomers. A step-by-step, hand-holding experience for people who aren’t as comfortable with server setup as many in this community are. There are people who need someone to explain every “why” and “what for”, walk them through installation, and then help them keep an eye on their node afterwards. I think this checker can become that tool - not just a diagnostic, but a guide from zero to a healthy running node. I honestly think that with the growth of NymVPN we will have more people like that around and some of them are already here.

I’m also open to the idea of this checker becoming part of someone else’s explorer - official or community - if the collaboration makes sense.

Budget:

Honestly, I don’t want to name a specific number. I built this for myself and I’m not sure how to fairly evaluate it. I fully rely on the team’s judgement. If they insist on me providing a figure, I can think about it.

Any questions? Go ahead

11 Likes

Great job. Well done!

3 Likes

Thanks for sharing this — looks really useful. Can you check the hardware requirements (CPU and RAM) used in your scoring?

2 Likes

Update #1:

  • Backend parallelization: 2-3x faster node checks (mixnode ~0.45s, exit gateway ~3.5s)
  • Minor requirement updates in line with current Nym documentation
  • SSRF protection in /api/check: blocks private, loopback, link-local and cloud metadata IPs
  • Removed downloading and root-level execution of the nym-node binary during sync - version is now parsed from the release tag_name
  • Auth on mutating endpoints (sync-reference, refresh, refresh-ipv6): localhost or admin token
  • Rate limiting: 30 requests/min per IP on /api/check
  • Security event logging (SSRF attempts, rate limit hits, auth denials) to a dedicated file
1 Like

Sure! Hardware specs are pulled from the node’s /api/v1/system-info endpoint. Minimums for full score: 2 CPU cores and 4 GB RAM. Below that you get proportional points.

Full Support this

1 Like

Update #2

Nym Checker - Update Report

Batch Check Feature

What’s new: Operators running multiple nodes can now check them all with a single click instead of punching in each one separately.

How it works

  1. Type the common part of your node names in the search box (e.g. nymlem, hermes, bwnym)
  2. A “Show all details (N)” button appears - runs a full check on every matched node in parallel
  3. Results unfold into a grid of up to 6 cards per row in a compact view with the key metrics
  4. Click any card → modal pops up with the full detail view (version, ports, IPv6, hardware, T&C, tips) - no extra API calls
  5. Close the modal by clicking the backdrop, the ✕ button, or pressing Esc

Manual selection

If you don’t want the whole bunch - checkboxes on every row in the list. A second button “Check selected (M)” shows up next to the main one.

Limits and safety

  • Max 35 nodes per batch request (covers the largest operator, Aether with 30 nodes, plus headroom)
  • Minimum 3 characters in the search query
  • Server-side semaphore limits 10 parallel checks inside a batch
  • Rate limiting and SSRF protection still apply to every node in the batch

Localization

All new strings translated to 9 languages: EN, RU, UK, ZH, ES, TR, DE, FR, IT.

Backend

  • New POST /api/check-batch endpoint with input validation and safety guards
  • Extracted shared _check_ip() helper used by both single and batch checks (no duplicated logic)
  • /api/nodes now requires at least 3 characters in the q parameter

Frontend

  • Compact card variant (renderDetailCard with a compact flag) - 2-column mini-grid, smaller score circle, closed-ports preview
  • Grid layout up to 6 columns, container widens to 1500px in batch mode
  • Modal popup with full detail renders over the grid without re-rendering the grid underneath
  • Staggered fade-in animation on cards (~0.07s step)

Nice work!

1 Like

Update #3

Session update:

  1. @wunderbaer bug fixed. Root cause: 1-CPU server with default ThreadPoolExecutor capped at 5 workers was choking on batch checks (100 socket ops queued against 5 threads, 95 timing out before execution). Rewrote ck_tcp and ck_udp using native asyncio (open_connection, create_datagram_endpoint), no thread pool involved. Batch time dropped from 30s to 2.6s, ports report correctly now.

  2. UDP flakiness fully eliminated. Switched to dual concurrent probes via asyncio.gather requiring both to return True (biased toward closed, since UDP open is just silence and ICMP can get dropped). Progression across iterations: 1 flaky → 3 → 0.

  3. Full network scan of all 750 nodes: 66 unreachable, 102 with stable port issues (operator configs), 0 flaky. Checker output is fully consistent.

  4. Mobile UX fixed. Responsive grid (1/3/6 columns by viewport width), detail mini-grid collapses to 2 columns on mobile, resize listener with 150ms debounce, fullscreen popup on phones, vertical toolbar on narrow screens.

Update #4

Security hardening

Admin auth: removed localhost bypass (all requests look local behind nginx reverse proxy). CORS locked to empty origins by default. Rate limiter: stripped localhost bypass, switched to _real_ip() that only trusts X-Real-IP/X-Forwarded-For from TRUSTED_PROXIES set (127.0.0.1, ::1). Spoofable header attack closed. SSRF protection on /api/check with private IP blocking.

Scoring rewrite

Exit policy scoring moved from global (any exit node gets credit if standard policy file loaded) to per-node: queries /api/v1/network-requester/exit-policy on each node, checks enabled + upstream_source. Probe failure returns status: "unknown" not declared: false. Same pattern as IPv6 absent-vs-unknown.

IPv6 provenance

/api/check now returns rich IPv6 object: status (trusted/confirmed/absent/unknown), source (api/dns/stockholm), checked_at (ISO timestamp). Frontend shows e.g. Yes (trusted via api). Exit policy also shows three states in UI: confirmed (green, port list), unknown (amber, “could not verify”), absent (red, “not declared”).

DNS resolution

Replaced gethostbyname() with getaddrinfo(AF_UNSPEC). IPv6 literals and AAAA-only hostnames now resolve. Multi-address fallback: tries all resolved IPs in order before failing, prevents false negatives on multi-record hostnames. All internal node URLs wrapped with _host_for_url() for IPv6 bracket normalization (http://[::1]:8080/...).

Performance

/api/nodes slimmed to 8 fields (137KB for 755 nodes vs full payload). In-memory node cache with file mtime check, disk read only on change. CoinGecko proxied through /api/price with 5-min backend cache. Frontend: debounce search (200ms), event delegation (1 handler vs N), pagination (50 + load more), stagger animation removed, Sync button removed (required admin token frontend didn’t have). response.ok checks on all 7 fetch calls.

Data integrity

Atomic file writes (temp + rename) under asyncio.Lock. Moniker cache now retries empty values on every refresh, full refresh on 24h file staleness. “Fully compliant” KPI fixed: counts version + toc + ipv6, not just version. identity_key removed from frontend search matcher (not in slim API, was a lie).

Infra

Lifespan context manager replacing deprecated @app.on_event("startup"). Persistent visitor salt file instead of daily rotation. STATIC_DIR configurable via env var. Version detection from hashes.json in GitHub releases (deterministic, no JS-rendered changelog parsing). Auto-sync every 3h: new nym-node releases detected and reflected within max 3 hours without manual intervention.

Great dashboard/explorer! :+1:

2 Likes

Update #5

SMTP egress monitoring

Exit gateways now show SMTP outbound status directly in the checker - a new row in the same style as T&C. Each exit is classified as Open (green), Partial (orange), or Blocked (red) based on probing four major mail providers (Gmail, Fastmail, Yandex, Outlook) on ports 25, 465, and 587. Daily automated probe runs against all exit gateways, results cached and refreshed every 24h. When blocked or partial, a recommendation appears with a link to the troubleshooting guide.

Port scoring rework

Separated nym-node ports from infrastructure ports after community feedback (thanks @starryxyz and @Merve). Ports that nym-node actually listens on (1789, 1790, 8080, 9000) affect the score. Ports that require nginx + domain + TLS (80, 443, 9001) are now shown separately in orange as “not configured” and don’t penalize the score - since having nginx and a domain isn’t a requirement for running a gateway. Removed port 4443 (QUIC bridge) from checks entirely as it’s a separate service.

Translations

All new UI elements translated across all 9 supported languages.

Upstream contributions

  • #6672 - SMTP egress troubleshooting docs, operator email templates, ISP table updates

Wish I saw this before I spent the last few days trying to figure this out. This is a great tool.

1 Like

Update #6

Insights tab
The dashboard gained a new top-level Insights tab that splits into two views, Countries and Providers. The Countries view scores every country by demand, neighbor coverage, strategic value, and saturation, then ranks them as recommended, neutral, oversaturated, or low-demand. Clicking a country opens a detail panel with the current node count, the ideal target, and the gap. 145 countries are covered, with operator-risk levels (safe, caution, dangerous) attached so you can read the legal context at a glance. The Providers view does the same for ASNs: 137 datacenter/hosting providers scored on concentration in the Nym network, IPv6 default, crypto payments, Tor friendliness, abuse tolerance, and SMTP egress quality. Clicking a provider shows its country breakdown and the actual nodes hosted there. Tab and selection persist in the URL, so you can share a link straight to a country or provider view.

Pre-release version detection
Versions ahead of the stable release are now shown as “pre-release” instead of “behind” or “current”. Three explicit states: current (matches stable), pre-release (ahead of stable), behind (older than stable). Pre-release nodes get a neutral badge instead of a warning, since running a release candidate is a deliberate choice and shouldn’t be punished in the score.

SMTP staleness
The SMTP probe runs daily, but if it stops for any reason the dashboard used to keep showing the last result as if it were live. Now if the probe data is older than 36 hours, the SMTP row degrades to “stale” and the source is marked accordingly. Same pattern as the IPv6 staleness handling that landed in #5.

Security hardening
Trust boundaries are now driven by environment variables instead of hardcoded values. The list of trusted reverse proxies, whether to honor X-Forwarded-For, and the Stockholm IPv6 agent URL all come from config. X-Real-IP is validated as an actual IP and is only honored on the first hop from a trusted proxy, never further down the chain. The IPv6 agent gate refuses to call the Stockholm helper over plain HTTP unless explicitly allowed, with an audit log entry on each refusal. Frontend helpers (badges, mini cards, detail rows) now escape every value before injection, and inline onclick arguments are escaped too. None of this fixed an exploitable bug, but it tightens the surface.

Polish
URL persistence for Insights tab and selected country/provider, translations across all 9 languages for every new string (provider notes, reasoning codes, status labels), classification fallback fix for low-demand high-income countries, and a sort-within-classification pass so the most relevant entries float to the top of each group.

1 Like

Where do I find this Insights tab? I’m on the Dashboard - but fail to see it :thinking:


here, last one :slight_smile:
http://185.186.76.89:8080/?page=insights

2 Likes

Am I on the wrong site? I’m on this one: Spectre Explorer

edit: aargh - shoot - I should use your link above :grinning_face_with_smiling_eyes: :roll_eyes:

we are not the same tool :smiley:

1 Like

Update #7

Insights overhaul
The Insights tab got rebuilt around what operators actually need to see. The single “most needed country” hero card became a Top-5 list, paired with a Top-5 oversaturated list so the deploy decision shows the full distribution at once. Below the hero, a new “Safe and needed (more options)” section surfaces all safe-jurisdiction countries with real node demand that didn’t make the top five. The classification groups got reordered — Highly recommended first, then Good, Caution, Low demand, Saturated, Not recommended — and Top-5 entries are deduplicated out of the groups below so the same country doesn’t appear twice on one page. Caution itself was rebuilt; previously it lumped together places where you legitimately can deploy with care (India, Kazakhstan, Turkey, Thailand) and places with effectively no hosting market at all (Bhutan, Mongolia, dozens of micronations). The latter no longer dominate the list. Kyrgyzstan moved from caution to safe after the legal review showed no enforcement against privacy-infra operators there.

Deep-linkable URLs
Every analysis now lives at a stable shareable URL. /country/DE, /provider/24940, /operator/{brand}, /plan — each renders the same SPA but loads the relevant view directly. Document title and meta description update per page, and Open Graph cards are wired up so a link dropped into a chat preview shows the country name and node count instead of a generic page card. Backwards-compatible — old ?page=insights&country=DE URLs keep working.

Operator-facing diagnostics
When a node has closed ports, the detail card now expands into a Port Diagnostics panel with the exact ss, ufw/iptables, systemctl, and journalctl commands the operator needs, plus a cloud-firewall reminder for Hetzner Cloud Firewall, OVH Anti-DDoS, AWS Security Groups, and DigitalOcean Cloud Firewall — the usual cause of “closed in our probe but the OS firewall is open” cases. A separate IPv6 Setup Guide panel covers 11 hosting providers (Hetzner Cloud, Hetzner Dedicated, OVH VPS, OVH Dedicated, DigitalOcean, Vultr, Linode/Akamai, Contabo, AEZA, FlokiNET, generic Other) with steps researched and linked to each provider’s own docs.

Plan your node wizard
A new /plan page walks an operator through four questions — node type, experience level, budget-irrelevant region preference — and returns a coherent plan rather than a country list and a separate provider list. The backend cross-validates: a country only appears if at least one provider in our dataset officially serves it (verified from the provider’s own location page, with a verified_at date), and providers in the recommendation are limited to those that actually operate in the chosen country. Eighteen of twenty-four providers in the dataset now have verified country coverage; the rest don’t show up in plan recommendations rather than appearing with unsourced claims. A “battle-tested here” tag highlights provider-country combinations where Nym nodes are already running.

Operator profile pages
Wallet-based grouping is useless on Nym because every node bonds with a separate wallet. Instead, the new /operator/{key} page groups nodes by brand-prefix moniker — NYMLEM STOCKHOLM GATEWAY, NYMLEM JOHANNESBURG GATEWAY, ✅🌐✅NYMLEM✅🌐✅, ✅🌐✅NYMLEM2✅🌐✅ all collapse to nymlem. CamelCase variants like BwNymGama, BwNymBeta, BwNymAlpha are merged into the same bwnym bucket via prefix matching against the full lowercase moniker. The page shows aggregated stats: total node count, mode breakdown (mix/entry/exit), countries, versions, and the full node list. Each node detail card surfaces a chip linking to the operator’s profile when at least two related nodes are found.

Comparison view
The node detail card now includes a “How your node compares” panel showing where the node sits relative to peers: number of same-mode nodes in the network, country concentration with percentage of total, ASN concentration with a warning for ASNs over 10% of network share, version status with the percentile of same-mode peers it outranks, and WireGuard enablement rate among same-mode peers with the node’s own state.

Historical data
Daily snapshots of every cached node go into a SQLite table, taken at ~00:15 UTC. The node detail card has a new 30-day history panel showing per-day status of Version, SMTP, IPv6, and Online presence as a colored grid. No extra probes — the snapshot reuses already-cached metrics. Over time the grid fills in and shows real trends; gaps mean the node wasn’t in our cache that day.

Multi-vantage cross-validation
Port probes from a single checker IP suffer from a systematic blind spot: if the provider blacklists the checker’s IP range, every node on that provider looks closed even though they’re fine for the rest of the network. To fix that, a lightweight port_probe_agent is now deployed on four operator nodes across four regions (Europe, Africa, the Americas, Asia). On every node detail card, a Multi-vantage port verification table shows each TCP port re-probed from every region with latency. Agreement across all four vantages means the port status is real; disagreement is flagged as a likely provider-level IP block, not a configuration issue. The same agent infrastructure was extended to SMTP — /api/smtp-vantages runs SMTP reachability probes to Gmail, Fastmail, Outlook, and Yandex from each vantage and aggregates the matrix. The actual vantage IPs are hidden behind region labels (EU/AF/AM/AS) in all UI output.

Source-attributed data
The country dataset previously had hardcoded population, GDP, internet penetration, freedom_total, and press_freedom values with no attribution. Numbers are now overlaid from country_metrics.json, built by build_country_data.py which pulls 217 countries from World Bank Open Data (population, GDP per capita, internet penetration) and embeds annual Freedom House and RSF snapshots. Every country detail page now shows a Data Sources block listing each metric with its provider, as_of date, and a clickable source URL. A monthly background task regenerates the JSON automatically. Provider quality flags (Tor-friendliness, abuse tolerance, crypto payments) got an evidence block for the five most-used providers — Hetzner, OVH, Vultr, DigitalOcean, FlokiNET — each claim now linked to the provider’s own ToS or AUP page with a verified date and a short justification. Smaller providers without evidence attached show a manual-judgment disclaimer rather than presenting opinion as fact.

Translations
Every new UI string was added to all nine supported languages (EN, RU, UK, ZH, ES, TR, DE, FR, IT) — Network Gaps labels, Safe-and-needed, Port Diagnostics, IPv6 Setup Guide, Plan wizard, Operator profile, Comparison view, Historical view, Multi-vantage table, source attribution copy.

Polish
Search input now resets all detail states (operator, country, provider, deploy, node) and returns to the nodes page — previously typing in search while on a profile page silently failed. Clicking a node from any list (operator profile, provider detail, plan wizard result) now opens the full detail card instead of just running a text search. Fixed a [object Object] rendering bug in provider detail where the count field clashed with a node list field of the same name. The operator_feasible legacy field was removed from the country dataset since the country↔provider validation in the Plan wizard supersedes it. Hardware requirements stopped being silently hardcoded — they now ship with a verified_at date and a link to the official Nym docs page for current values, with an admin endpoint for manual updates when the docs change.

One feature I have in my mind as a possibility is some sort of eco score. This could be, say, the mass of CO2 released by a node per year or month. I’m not sure what the path of least resistance would be, but I’m sure that one could find a dataset of average CO2 mass per kWh generated in each country, then approximate kW using RAM, CPU count, and (maybe) bandwidth served?

I could imagine someone interested in Nym but wary of the environmental impact of coins like BTC and avoiding the project because of that. But maybe with some (approximate) environmental impact data those people will be more comfortable with the project and, hopefully, motivated to choose nodes that are better for the environment when staking.

The inspiration for this is the green algorithms calculator for estimating the environmental impact of supercomputing jobs: https://calculator.green-algorithms.org

2 Likes